TSNN Releases First-of-its-kind Data on 6-Year Trends of Top 250 Trade Shows
September 21, 2020

In an exciting trade show industry deep dive, Trade Show News Network, in partnership with data analytics company Bear Analytics, have teamed up to unveil a dynamic dashboard of the TSNN Top 250 Trade Show list metrics.
The dashboard includes U.S. data from 2014-19 and is the most comprehensive look at large trade show data anywhere.
Analyzing more than 1,477 trade shows that represent 24.8 million attendees, 1.1 million exhibiting companies and more than 393 million net square feet, the dashboard is complimentary to all users and allows them to search data on all of the shows including the host cities with a robust map. This engaging tool is highly visual, showcasing this compelling data in a new light for the first time in history.
Bear Analytics has partnered with TSNN to bring this data to the forefront for increased exposure and utility for all those in the events industry at a time when they need it the most to make informed decisions.
Access the TSNN Top 250 Dashboard here.
“Bear Analytics is excited to be working alongside the TSNN team for the second consecutive year to drive insights from the Top 250 Trade Show list,” said Joe Colangelo, CEO of Bear Analytics. “During these times of disruption for the events industry, we believe it’s critical to pay attention to the macro-level trend data that is critical to understanding the impact from the COVID-19 pandemic.”
He continued, “For this year, we’ve enhanced the functionality of the dashboard to make it easier to find insights into historical performance across the domestic U.S., individual show rankings and year-to-year changes on attendance and net square footage. As this data continues to evolve over time, it'll be increasingly interesting to understand the role 2020 played in our industry's history."
A few examples of fresh data yielded in the TSNN Top 250 Dashboard include:
- Both Natural Products Expo East and West have sustained Top 250 ranking improvement every year from 2014-19
- FABTECH experienced more than 20 percent growth in both its reported NSF and attendees from 2018 to 2019
- Coffee Fest’s three events (Coffee Fest PNW, Coffee Fest, and Coffee Fest Indianapolis) all made the list for the first time in 2019
The TSNN Top 250 dashboard includes data from the 2014–19 TSNN Top 250 list, including metrics surrounding individual event performance across exhibition, attendance, location and timing.
These data points were further enhanced by Bear Analytics through a focused enrichment process to add context for the end user to be able to slice and dice the data more efficiently.
“The TSNN Top 250 dynamic dashboard is a visual representation of the trade show industry’s biggest shows during the past six years,” said TSNN President Rachel Wimberly. “Bear Analytics has developed a tool like no other in the industry utilizing TSNN’s one-of-a-kind data. We have no doubt that trade show industry organizers and suppliers alike will find this new dashboard tool very valuable.”
The 2019 TSNN Top Tradeshows dashboard offers three main areas for users:
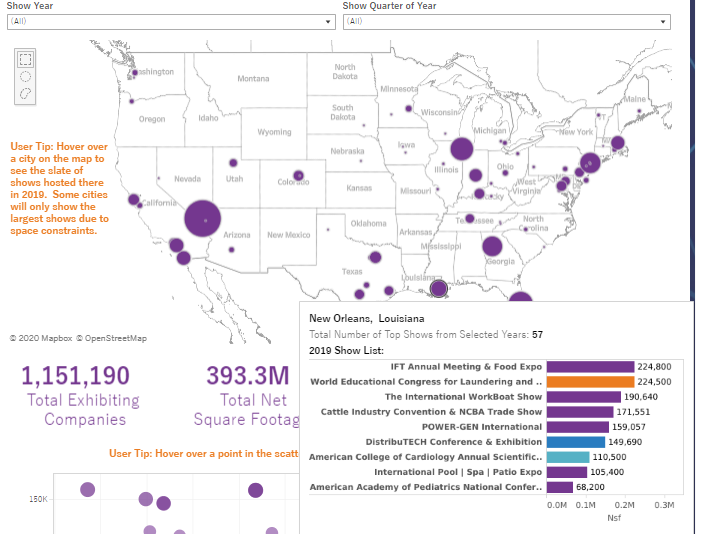
Section 1: Historical Event Performance across the US (2014-19)
This section showcases the national impact of the Top Trade Shows by highlighting the locations of the past six years of Top Trade Shows. The dynamic map allows the user to focus in on key performance by all years 2014-19 or to look at a single year. The map is also filterable by the time of year the event takes place. As an added level of context, hovering over a city on the map reveals the top 2019 events hosted in each city according to their self-reported exhibitor net square footage.
Section 2: TSNN Individual Show Rankings Historically
TSNN’s Top Trade Show list changes annually. As industries have evolved, modified, grown and contracted, events have ascended, descended and jumped onto and off of TSNN’s Top 250 list. This searchable pane showcases the annual trending per event and allows the user to search for a specific event or multiple events to compare over the past six years.
Section 3: Annual Event Performance Change
This section looks at how event performance ebbs and flows year to year based on both the number of attendees and the total NSF reported by the show organizers. Users can customize these performance benchmarks by including shows taking place at specific times of the year and in selected U.S. regions, or in ranking quintiles. The average change in the reported metrics for all selected Top Shows across each two-year span can be used by event organizers to measure their specific show’s performance.
Access the TSNN Top 250 Dashboard here.
Bear Analytics is a data analytics firm dedicated to translating data into actionable intelligence for event producers, trade associations, and professional societies. Bear’s progressive, data-first approach embraces innovation to deliver insights that inform strategy and incite action.
Partner Voices

MGM Resorts is committed to fostering an inclusive and diverse culture, not just among employees and guests but also within its supply chain. The company prioritizes procuring goods and services from businesses owned by minorities, women, veterans, people with disabilities, LGBTQ individuals and those facing economic disadvantages. This commitment is integral to MGM Resorts' global procurement strategy.
Through its voluntary supplier diversity program, MGM Resorts actively identifies and connects certified diverse-owned suppliers to opportunities within its supply chain. The company is on track to spend at least 15% of its biddable procurement with diverse-owned businesses by 2025, demonstrating that supplier diversity is not only a social responsibility but also a strategic business imperative.
Supplier diversity isn’t just the right thing to do – it’s good for business. A diverse supply chain allows access to a broader range of perspectives and experience, helping to drive innovation, entrepreneurship and resilience, while strengthening communities. At MGM Resorts, engaging diverse suppliers ensures best-in-class experiences for guests and clients. Supplier diversity ensures a more resilient supply chain while supporting economic development in the communities in which it operates.
The impact of MGM Resorts' supplier diversity initiatives is significant. In 2023, these efforts supported over 3,500 jobs across more than 30 states, contributed over $214 million in income for diverse-owned businesses and generated more than $62 million in tax revenue. The story extends beyond the numbers – it reflects the tangible benefits brought to small and diverse-owned businesses, fostering economic empowerment in their communities.
MGM Resorts also supports the development and business skills of diverse-owned businesses through investment, mentorship and education. Through the MGM Resorts Supplier Diversity Mentorship Program, the company identifies, mentors and develops diverse-owned businesses to fill its future pipeline, while providing businesses with tools and resources to empower and uplift. Since 2017, the program has successfully graduated 105 diverse-owned businesses and is on track to achieve its goal of 150 graduates by 2025.
MGM Resorts’ commitment to supplier diversity not only enhances its business operations but also plays a crucial role in uplifting communities and fostering economic development. This approach reinforces the idea that diversity is a powerful driver of innovation and resilience, benefiting both the company and the wider community.
Add new comment